AI Real-Time Data Analytics and Cloud Integration Best Practices
Explore AI real-time data analytics and cloud integration, covering data paths, storage, anomaly detection, and operational best practices.
Map the event path
A temperature reading lands with a device ID, timestamp, value, firmware version, and location. Before sending it to a model, write down where that event enters, where it is durably stored, who reads it, and how quickly each consumer needs it.
Your dashboard may need the latest reading within seconds, while a maintenance model may score a rolling hour of vibration data. A training job may read months of raw files. Those are three workloads, and forcing them through one database usually creates avoidable cost and latency.
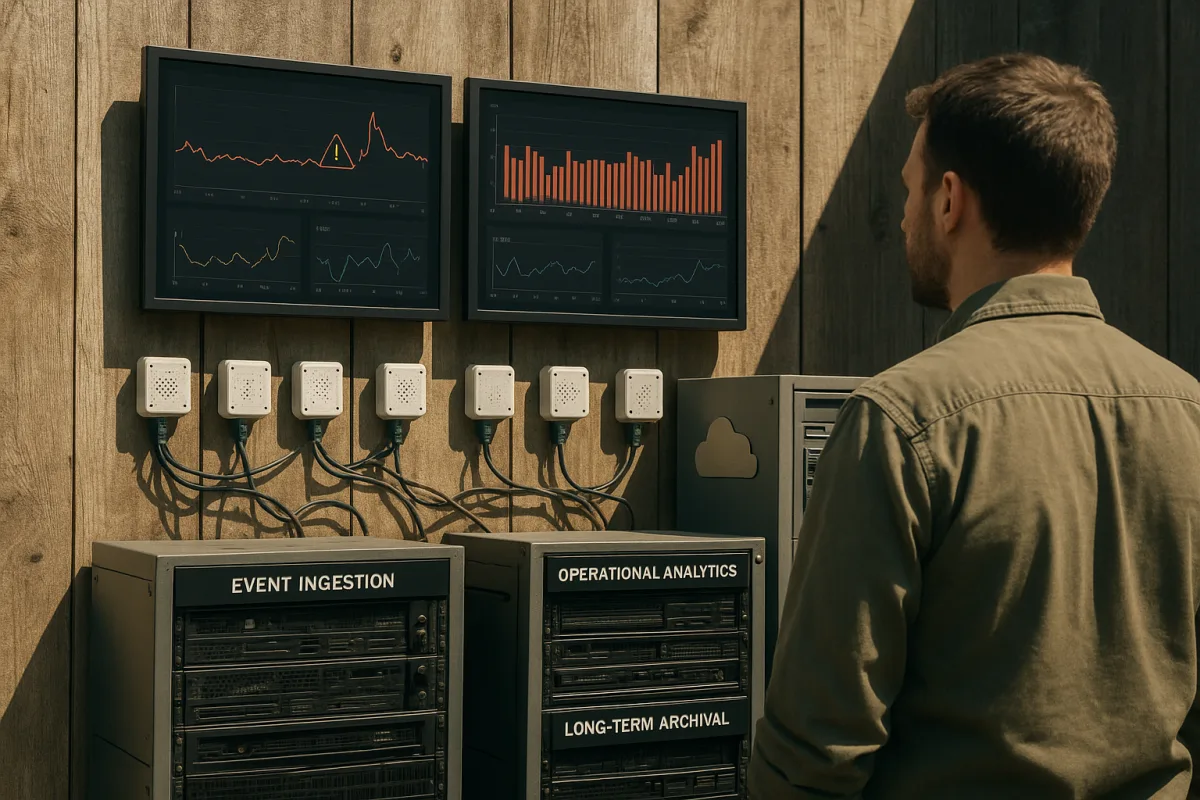
We would draw the path as four layers: device or gateway, event ingestion, operational analytics, and durable object storage. Put AI inference beside the data it needs, then send only the resulting score, alert, and explanation to the application backend.
This also gives you failure boundaries. If an anomaly service is unavailable, ingestion should continue and preserve raw readings for later scoring, while the dashboard can show that its prediction is delayed instead of silently presenting stale results.
Set residency and access rules before selecting regions
A region picker appears early in every managed-cloud setup, but it determines where sensor history, user accounts, model outputs, and backups live. Pick regions based on device geography, user latency, and the jurisdiction that governs the data.
Healthcare workloads can bring HIPAA requirements, payment data can bring PCI DSS obligations, and personal data can bring GDPR obligations. LegalClarity’s compliance overview also emphasizes that cloud compliance spans data handling, access control, and auditability, not only where a database runs.[4]
Keep a data inventory that names each stream, its owner, retention period, classification, and destination. NIST-oriented security guidance commonly starts with inventory and secure configuration, because you cannot restrict or delete data reliably if no one can identify the systems holding it.[4]
Cloud providers secure underlying infrastructure, but you still control application identities, database rules, service-account keys, and logging. Datadog’s 2026 UK storage announcement for regulated industries illustrates why locality can become a purchasing and architecture requirement, not a checkbox added after launch.[3]
Separate the hot operational store from the data lake
Sensor events are append-heavy and time-indexed. Your operational store needs to answer questions such as the latest pressure for pump 42, the maximum temperature by minute, or devices that crossed a threshold in the past fifteen minutes.
Tiger Cloud is a managed PostgreSQL service with the TimescaleDB extension, built for time-based data. Its hypertables partition data by time, continuous aggregates precompute recurring summaries, and Hypercore combines row-oriented and columnar storage behavior for mixed workloads.[1]
Krish Naik’s Tiger Data walkthrough uses generated sensor readings to create about 1.7 million rows, then explores querying, compression, dashboard performance, experiment copies, and semantic search. That is a credible shape for a prototype, but it does not establish that semantic search improves fault detection.
Send original files, device payload archives, images, and training datasets to object storage. Keep relational metadata and queryable event windows in the time-series database, since object storage is durable and economical for files but does not replace indexed operational queries.
Choose retention and aggregation windows
Raw readings accumulate fast, especially when many devices report several metrics each second. Define separate retention rules for raw events, minute aggregates, hourly aggregates, model features, alerts, and audit records before you begin ingesting production traffic.
For example, a dashboard may only require one-minute summaries after thirty days, while an incident investigator needs the raw window around an alert. Continuous aggregates let you maintain those summaries in the database instead of repeatedly scanning every original reading.[1]
Tiger Data lists its Performance plan from $30 per month and its Scale plan from $36 per month, with storage billed separately at $0.177 per GB per month for standard storage and $0.021 per GB per month for tiered storage.[1] Those starting plan prices do not include storage.
The Performance plan includes up to eight CPUs, 32 GB of memory, single-node high availability, and three-day point-in-time recovery. Scale raises limits to 32 CPUs, 128 GB, multi-node high availability, fourteen-day recovery, and read scaling.[1]
Build ingestion for replay, not only speed
Give every incoming event a stable event ID, device ID, observed timestamp, received timestamp, schema version, and source sequence number. The received time helps diagnose network delay, while the observed time preserves what actually happened at the sensor.
Use idempotent writes or deduplication rules, because gateways reconnect and devices resend data. If an event arrives twice, your anomaly baseline should not treat it as two separate temperature spikes, and your billing or compliance records should remain explainable.
Validate fields at ingestion, then route malformed events to a quarantine stream with the raw payload and reason code. Do not discard them silently, because a firmware rollout can change units or field names without warning and make a healthy fleet look anomalous.
Keep the ingestion service independent from the model service. This lets you replay a known event range into a revised feature pipeline, compare model versions, and repair downstream tables without asking devices to generate the same conditions again.
Add AI after baseline rules work
Start with explicit rules for conditions your operators already understand: pressure above a hard limit, a device offline for a defined interval, or a rate of temperature increase beyond a safe threshold. These alerts provide labeled incidents and a benchmark for later models.
Then build features over windows: rolling mean, variance, minimum, maximum, rate of change, missing-reading count, and deviation from a device’s usual range. Store both the features and model version alongside each score, so you can reconstruct why an alert appeared.
An anomaly score is not a diagnosis. Present it as a ranked signal with the input window, confidence or score, triggering features, and action policy, such as notify an operator, request a second measurement, or create a maintenance ticket.
If you use an LLM to summarize alerts or query operational history, log prompt version, retrieved records, output, latency, and token usage. Thousands of agents producing logs and making model calls create the same observability problem as a sensor fleet, only with token consumption attached.
Connect the application backend without making it the event bus
Firestore fits application-facing state such as user profiles, alert acknowledgments, equipment assignments, conversations, and workflow status. It is a poor place to write every raw sensor reading when a time-series store is already handling high-volume time-based events.
The Google Cloud Tech Firebase build registers a web app, adds authentication, creates Firestore in production mode, publishes security rules, and uses an Admin SDK service account for server access. Follow that separation: client credentials configure the app, while privileged service credentials stay on the server.
Use snapshot listeners for live application views, such as an alert queue or maintenance task changing status. Firestore’s scaling guidance focuses on designing real-time listeners for the expected query pattern and load, instead of treating listeners as an unlimited broadcast mechanism.[6]
Avoid repeatedly updating a single document with fleet-wide counters or “latest event” state. High write rates to individual documents can cause contention and latency, so shard counters, maintain device-level records, or write aggregates in batches where your interface allows it.[6]
Lock down identities and database rules
Authentication proves who the user is. Firestore rules determine which records that user can read or write. The Firebase walkthrough describes rules as server-side checks applied on each request, which is the right mental model for protecting application data.
Give each user access only to their organization, assigned devices, and permitted workflows. Do not rely on a hidden user interface control to protect raw data, model outputs, or administrative actions, because clients can call backend APIs directly.
Treat service-account JSON as production credentials. Store it in a secret manager or protected deployment configuration, rotate it when exposure is suspected, and prevent it from entering source control, browser bundles, logs, or AI coding-agent context.
Ramp a new Firestore collection gradually. Firestore advises starting at 500 operations per second and increasing traffic by 50 percent every five minutes, giving the service time to distribute load and revealing bad document or index patterns before a full rollout.[6]
Feed training jobs through a high-throughput file system
A training job that reads large datasets repeatedly has a different storage need from a dashboard request. Cloud Storage is a durable object store, while Managed Lustre provides a mounted file system for workloads that need very low-latency, high-throughput access.
Google Cloud Tech’s Managed Lustre mirror demonstration links a Cloud Storage bucket to a Lustre file system through an automated, one-way synchronization. Bucket creates, updates, and deletes trigger background synchronization, removing the need for custom copy scripts.[7]
Google Cloud documentation lists proactive hydration at up to 100 GB per second for initial warming and 3.5 GB per second for ongoing synchronization.[7] Treat those figures as infrastructure throughput, not an end-to-end training benchmark, since training performance also depends on file layout, compute, and model behavior.
Map only the Cloud Storage paths that belong on the shared training file system. Keep local Lustre directories for checkpoints or job outputs that should not be overwritten by bucket events, because unmirrored directories remain untouched.[7]
Define conflict and deletion behavior explicitly
Cloud Storage wins when a mirrored path conflicts with a local Lustre edit. Google Cloud says object updates overwrite local mirrored-directory edits, while structural collisions are skipped and recorded in Cloud Logging.[7]
That means mirrored directories should be treated as read-only by training jobs and data-preparation workers. Write derived artifacts, temporary files, and checkpoints outside the mirrored path, then promote approved data back to Cloud Storage through a controlled publishing step.
The mirror can retain deleted Cloud Storage files on Lustre with the deleted-files-retained setting, or propagate deletions when that setting is disabled.[7] Retention is appropriate when a running job needs a safety buffer, but it can consume expensive high-performance capacity.
Use a least-privilege identity for the mirror. Google Cloud Tech’s setup creates a custom role with only the bucket and object permissions needed by Managed Lustre, then binds that role to the Managed Lustre service account instead of granting broad project access.
Build a developer-only sensor and model inspector
A bad alert often appears only after a particular sequence of readings, authenticated user state, and AI response. Reproducing that by waiting for live devices wastes time and can repeatedly trigger paid model calls.
Google Cloud Tech built a development-only inspector for an AI application, with named component presets, editable state, incoming properties, computed state, and plain-English tests. Apply the same pattern to a device detail panel, alert card, and model-explanation view.
Create presets such as “normal operating range,” “missing data,” “rapid increase,” “false positive,” and “critical alert acknowledged.” Each preset should load a frozen event window, a known model version, and expected user-interface results from a fixture, not production records.
Keep the inspector out of production builds or behind strong administrator controls. Also display when its configuration was last regenerated, because generated controls can drift after component interfaces, feature definitions, or tests change.
Operate the pipeline with budgets and evidence
Measure ingest lag, duplicate rate, malformed-event rate, query latency, listener count, model latency, alert precision, alert recall, and storage growth. A dashboard that only reports model accuracy can hide the operational failures that prevent a correct model from reaching users.
Set budgets for database compute, storage tiers, cloud egress where applicable, and model usage. Tiger Cloud pricing separates service plans from storage, so a low entry plan does not tell you the monthly cost once raw sensor history expands.[1]
Review false positives with the operators who receive them. Their dispositions become training labels, while the event window, device condition, feature values, and model output form the evidence needed to improve a detector without turning every threshold breach into an AI project.
We would start with durable event capture, time-window queries, aggregates, and explicit alerts. Add AI once you can replay events, measure outcomes, secure every backend path, and show an operator exactly what data produced a recommendation.
Frequently Asked Questions
How does AI improve real-time data analytics?
AI enhances real-time data analytics by enabling anomaly detection and predictive scoring on sensor data streams. It processes data close to where it is ingested, producing alerts and explanations that can be quickly consumed by applications without delaying raw data storage or dashboard updates.
What are best practices for AI in real-time data processing?
Best practices include separating raw sensor ingestion, AI inference, user-facing state, and training data onto different paths to meet their distinct latency and consistency needs. Use idempotent writes to handle duplicate events, validate data at ingestion, and build developer tools to replay sensor states and AI outputs for debugging.
What are the challenges of AI in real-time sensor data?
Challenges include managing different latency and storage requirements across ingestion, inference, and training workloads. High-frequency writes to the same database documents can cause contention and latency, and maintaining consistent, explainable anomaly detection requires careful handling of duplicate or delayed events.
How to separate data paths for AI inference and storage?
Separate the event flow into layers: device or gateway, event ingestion, operational analytics, and durable object storage. AI inference should be colocated with the data it needs and output only scores and alerts to the application backend, while raw data is stored separately for durability and later training use. This approach also isolates failures and optimizes performance.
How we researched this
This article was assembled from 4 video sources across 2 channels, 7 cited references.
Nothing here is based on hands-on testing. Where a figure or finding appears, it belongs to the source cited beside it, and the writing says so rather than implying otherwise. Every source is listed below so you can check it.
Sources
Real-Time Sensor Data Analytics & AI Implementation with Tiger Cloud, Krish Naik
Build a hidden edit mode for your AI app with reusable agent skills, Google Cloud Tech
From prototype to real Firebase backend (no code), Google Cloud Tech
How to mirror Cloud Storage buckets to Managed Lustre, Google Cloud Tech
Tiger Cloud Pricing. Scale Further. Spend Less. | Tiger Data
Public Cloud Compliance: Key Frameworks and Requirements - LegalClarity
Understand real-time listen queries at scale | Firestore | Firebase
Mirror from Cloud Storage | Managed Lustre | Google Cloud Documentation
Watch AI in Real-Time Data Analytics and Cloud Integration on Youtube
Also from the sources
Related Articles
AI Agents Data Governance and API Integration Best Practices
Explore AI agents data governance and API integration to ensure reliable, real-time responses in specialized domains.

AI Agents with Real-Time Vision and Multimodal Capabilities
Explore advances in AI agents using real-time vision and multimodal capabilities for improved task handling and voice-vision integration.

Voice Assistant Development Patterns for Real-Time AI
Explore voice assistant development patterns, latency challenges, and multimodal AI integration for real-time voice applications.

AI Agents in Real-Time Applications
Explore how AI agents work in real-time sports, robotics, and voice AI, focusing on latency, specialized tooling, and practical deployment challenges.