Power BI Mapping: Visualize Geographical Data with Edureka!

- Authors
- Published on
- Published on
In this thrilling adventure into the world of Power BI, the Edureka team takes us on a journey to master the art of creating dynamic maps that will leave you breathless. Buckle up as we learn how to unleash the full potential of geographical data, transforming it into visually stunning insights that will make your jaw drop. From plotting basic locations to unlocking advanced geospatial insights, this is a ride you don't want to miss.
Before we dive into the nitty-gritty, make sure your map settings are revved up and ready to go. Import your dataset like a pro, ensuring it includes all the essential columns like city, state, country, latitude, and longitude. With a flick of a switch, transition to the report view and watch as the magic unfolds before your eyes. Select the map visual from the panel and resize it for maximum impact - this is where the real fun begins.
Drag the country column into the location field and watch as the map comes alive with vibrant blue bubbles representing each country in your dataset. Add the order ID column to adjust bubble sizes based on the number of orders in each country, creating a dynamic visual feast for the eyes. Enhance the map further by color-coding bubbles based on region categories and including the sales column in the tooltips field for a comprehensive view of sales data. With a few tweaks to settings like zoom buttons, map style, title, and font size, you'll have a map that not only informs but captivates. So, strap in and get ready to revolutionize your data visualization game with Power BI like never before.

Image copyright Youtube
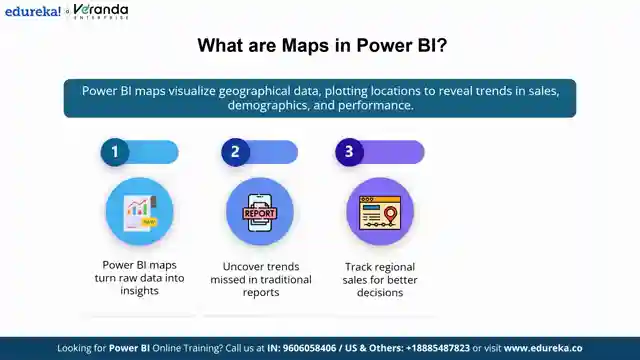
Image copyright Youtube
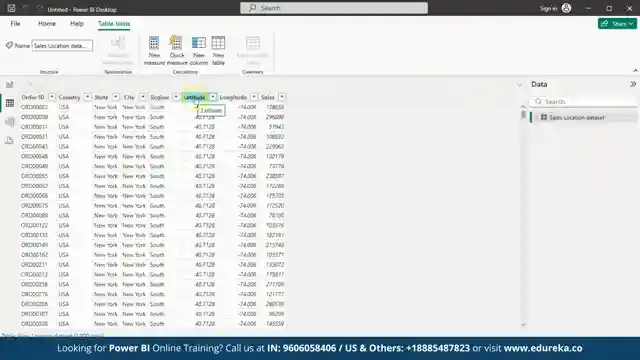
Image copyright Youtube
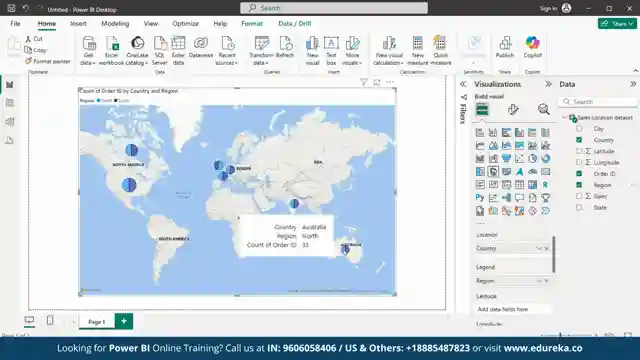
Image copyright Youtube
Watch How to Create Maps in Power BI | Visualize with Maps in Power BI | Power BI Tutorial | Edureka on Youtube
Viewer Reactions for How to Create Maps in Power BI | Visualize with Maps in Power BI | Power BI Tutorial | Edureka
Unfortunately, there are no comments to summarize for this video.
Related Articles

Mastering SSRF Attacks: Types, Impacts, and Prevention
Edureka explores SSRF attacks, a critical vulnerability exploiting web servers' trust in internal resources. Learn about types, impacts, prevention.

Master Principeto Project Management: Certification Paths & Strategies
Discover Principeto project management with Edureka! Learn about the certification paths, essential topics, and exam preparation strategies. Elevate your career with globally recognized Principeto certifications.

Master ReactJS: Core Concepts, Projects, and Career Tips
Explore ReactJS with Edureka! Learn core concepts, project building, and career tips. Discover React's component architecture, virtual DOM efficiency, and why it's the top choice for developers. Get ready to master React and enhance your front-end skills!

Master AI Engineering: Python, Deep Learning, and Specializations
Discover the exciting world of AI engineering with Edureka! Learn Python, deep learning, and specializations like generative AI and NLP. Build a strong portfolio and stay ahead in the age of artificial intelligence.