
AI Model Observability and Training Infrastructure Explained
Learn how AI model observability and training infrastructure improve agent reliability using trace-verifier loops and structured telemetry.
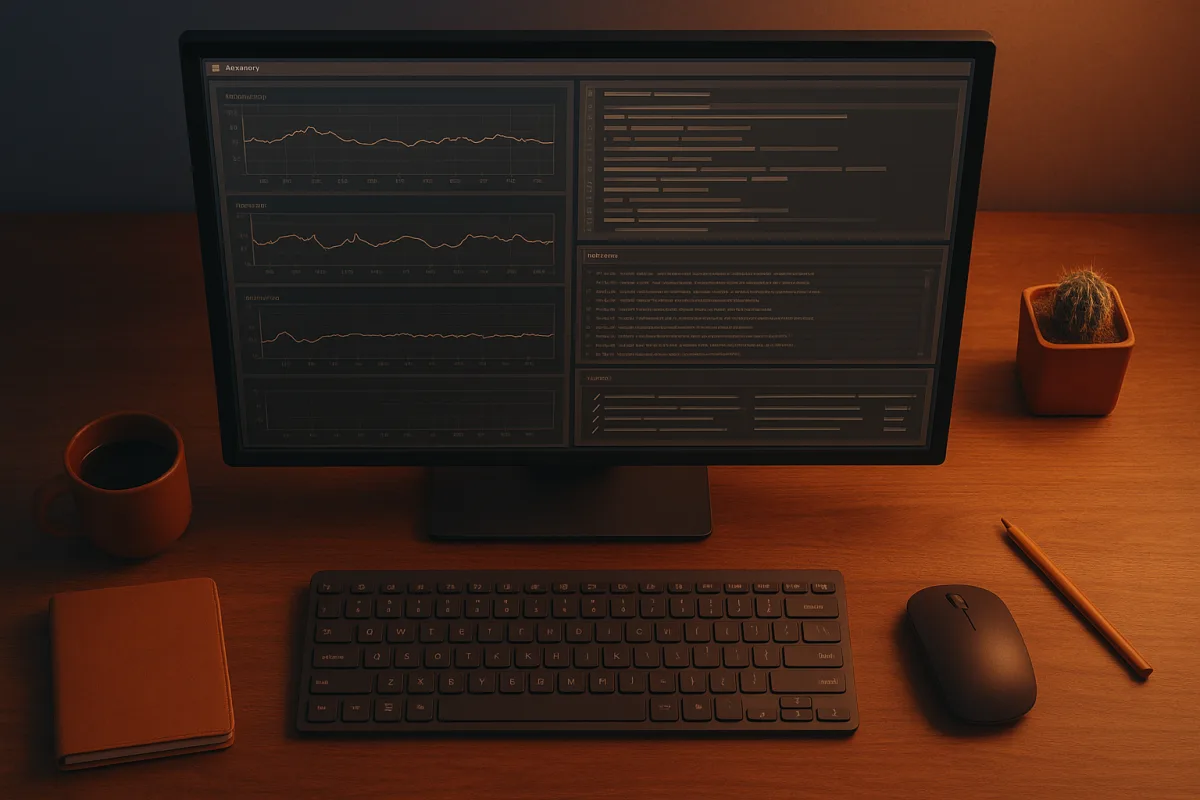
The trace-verifier loop
The most useful unit of AI agent infrastructure is not a prompt log, a benchmark score, or a GPU throughput number. It is the trace-verifier pair: a record of what an agent actually did, coupled with a test that can decide whether the resulting state was correct.
That distinction matters because agents routinely fail without producing an exception. A system can return a fluent answer, successfully call every API, stay within latency limits, and still refund the wrong customer or update the wrong ticket.
Machine Learning Mastery’s agent-observability guide makes the failure mode concrete: conventional uptime monitoring sees an apparently healthy service, while a trace can reveal duplicated tool calls, misleading retrieval, or a valid-looking action taken for the wrong reason. The operational question is not merely whether the process completed. It is whether the run changed the world correctly.
A trace is therefore more than a chronological list of application events. It is a causal structure. One user request starts an agent run, which creates one or more model calls, each of which may trigger retrieval, tool execution, handoffs to other agents, retries, and a final response.
OpenTelemetry’s generative-AI conventions give that structure common names. An invoke_agent span represents the overall run, chat spans represent model inference, and execute_tool spans represent calls to external systems. Parent-child nesting preserves the decision path rather than leaving engineers to correlate timestamps manually. [4]
That nesting makes a practical difference during debugging. If an agent makes two refund-lookup calls, the trace should show whether the second call was a deliberate retry after an error, a fallback after low confidence, or simply an unnecessary repetition caused by the model losing track of its earlier result.
What to record, and what not to record
A useful tool-call record needs more than “tool succeeded.” It should include the trace ID, tool name, sanitized arguments, start and end time, status, response size, retry count, and a representation of the environment state before and after the action.
For model calls, the corresponding fields include provider, model identifier, sampling settings, input and output token counts, finish reason, latency, and a reference to the prompt template or agent version. Those fields allow an operator to distinguish an expensive reasoning loop from a slow database query.
The important word is structured. Free-text logs are readable in the moment but difficult to aggregate later. A team cannot reliably ask “which tool causes most retries after a retrieval miss?” if one service calls the event lookup_failure and another writes an English sentence.
Structured logging frameworks such as AgentTrace are intended to capture operational, cognitive, and contextual surfaces of agent execution. That framing is useful, provided “cognitive” does not become an excuse to collect hidden reasoning text or every intermediate prompt verbatim. [1]
The better practice is to record observable decisions and artifacts. Store that the model selected a tool, the tool schema version, the arguments after redaction, and the result classification. Do not assume a raw internal reasoning transcript is either necessary for diagnosis or safe to retain.
This is partly a privacy issue and partly an engineering issue. Full prompts and tool responses can contain customer data, credentials, proprietary documents, or regulated personal information. A trace backend becomes an additional sensitive-data system if teams log everything by default.
The OpenTelemetry Collector is useful here because it can filter, redact, sample, or route telemetry between the application and the final storage system. That lets an organization change retention or redaction policy centrally, rather than requiring every agent developer to get logging details right.
Retention is not simply a storage-cost decision. The research brief notes that high-risk AI deployments under the EU AI Act may require logs to be retained for at least six months, while SOC 2 Type II audit expectations commonly involve one-year audit trails. GDPR obligations can pull in the opposite direction by requiring disciplined records of processing and data minimisation.
That tension means “keep all traces forever” is not an observability strategy. Tamper-evident metadata, short-lived encrypted payload storage, role-based access, deletion workflows, and redacted long-term aggregates are more credible design choices than a single indiscriminate log bucket.
A trace becomes useful only when a verifier exists
Tracing explains a run. It does not, on its own, establish that the run was good. A customer-support agent might call the correct tools efficiently and still make an unsupported policy decision in its final message.
This is where the verifier enters. A verifier is executable logic that inspects the final state or output and decides whether the task’s requirements were met. For a ticketing task, it may check that the right account received the right update, no prohibited field changed, and the response contains required information.
ServiceNow CoreAI’s AutoSynthData work is built around this idea. The system does not merely generate plausible enterprise prompts. It generates a system specification, a user request, an environment state, a reference trajectory, and a verifier capable of judging the result. [7]
That is a higher bar than conventional synthetic instruction generation. A synthetic request can sound realistic while being impossible in the target environment, depending on unavailable tools or data. It can also be solvable, but paired with a verifier so weak that it accepts an incorrect final state.
The ServiceNow team describes three properties of useful generated tasks: feasibility, realism, and difficulty. The task must be executable, resemble work a user could plausibly request, and expose a weakness the target model has not already solved reliably. [8]
The verifier has equally demanding requirements. It must be consistent with the prompt and state, sound enough to reject wrong outcomes, and complete enough to accept more than one valid path. A verifier that hard-codes a single reference sequence can punish an agent for finding a legitimate alternative.
AutoSynthData applies positive and negative checks before accepting a sample. The positive check replays the intended solution and confirms that it passes. The negative check perturbs expected outcomes to see whether incorrect states are rejected, a basic but important defense against vacuous success criteria. [7]
This is the connection between observability and training infrastructure. Traces identify recurring failure patterns, such as selecting the wrong knowledge article after a status lookup. Verifiers turn those patterns into testable capabilities, and only then can a pipeline safely generate varied training examples around them.
From one failure to a training distribution
A single bad trace is not a fine-tuning dataset. It identifies a hypothesis about a capability gap. The agent may fail because it cannot sequence two tools, cannot interpret an API result, ignores a policy constraint, or receives stale retrieval context.
AutoSynthData uses a stronger teacher model to help characterize such gaps and produce successful demonstrations. It then varies entities, initial state, wording, tool combinations, and solution paths, while holding onto the underlying skill being trained. [7]
The system’s “multiply” phase is a sensible guardrail. Variants are created from accepted core samples, but multiplied samples do not themselves become seeds for further multiplication. That limits generational drift, where a synthetic dataset gradually becomes detached from real workflows.
In ServiceNow CoreAI’s EnterpriseOps Gym experiment, the authors report generating 2,000 synthetic samples in roughly 18 hours. Fine-tuning their target model raised mean Pass@1 by 7.2 percentage points, from a verifier success rate of 63.01 percent to 68.55 percent. [7]
Those are meaningful benchmark gains, but they are not proof that a broadly deployed enterprise agent becomes reliable. The benchmark measures success in a particular stateful environment with its own tools and verifiers. It does not measure unknown production integrations, adversarial users, policy changes, or silent verifier defects.
Synthetic-data pipelines also have familiar risks. Bias in the teacher or generator can become amplified, contaminated data can create misleading gains, and training too heavily on generated material can narrow a model’s distribution and harm generalisation. Model collapse is a real concern when synthetic outputs displace diverse, high-quality source data. [9]
Machine Learning Mastery’s temporal Graph-RAG example points to another practical failure source: state changes. If a graph says one person was a company executive last week and another person holds the role today, a trace should record the retrieval timestamp and knowledge snapshot, not merely the retrieved text.
A verifier can then test the state that was valid at execution time. Without that temporal context, a team may incorrectly diagnose an agent as hallucinating when it instead acted on stale but internally consistent retrieval. Freshness is part of the environment, not decorative metadata.
Why MoE training infrastructure changes the economics, but not the evidence standard
Once a trace-verifier loop produces a trustworthy stream of hard examples, training becomes the bottleneck. That is where mixture-of-experts, or MoE, systems are attractive: a model can contain many specialised expert networks while activating only a small subset for each token.
Hugging Face’s announcement of the Allen Institute for AI’s Olmo-core 3 reports a benchmark that expanded an expert pool from eight to 128 experts. It kept four experts active per token, increasing total capacity from 4.6 billion to 47 billion parameters with less than a 5 percent throughput decline. [2]
The mechanics matter. A sparse MoE saves arithmetic because not every parameter participates in every token. It does not eliminate memory or communication costs, because all experts and their training state must still be distributed across GPUs and updated during training.
Olmo-core 3 moves away from an earlier fully sharded data-parallel design that repeatedly gathered and reshared weights. Its distributed data-parallel approach keeps experts resident on GPUs and routes token representations to the relevant experts, avoiding that repeated weight movement. [2]
The catch is all-to-all communication. A token routed to an expert on another GPU must travel there, be processed, and return to the next stage. Increasing expert capacity can therefore turn a compute problem into a network problem, especially when routing is uneven.
The Olmo-core 3 result is promising, but it should be read as a configuration-specific systems result, not a universal law of MoE scaling. Other MoE performance research finds substantial throughput differences as the number of active experts rises, because more active experts generally mean more communication and coordination. [10]
The project reports 52,000 tokens per second per GPU for a 47-billion-parameter MoE on eight NVIDIA B300 GPUs, compared with 19,400 using its earlier stack. It also reports a 1.2-trillion-parameter configuration across 512 GPUs, measured using random routing for systems performance. [2]
Random routing is appropriate for isolating infrastructure throughput, but it omits learned routing behaviour, load imbalance during real training, data-pipeline stalls, failures, and model-quality outcomes. Likewise, a short-capacity demonstration at 2.38 trillion parameters establishes that a configuration can be instantiated, not that it can be trained economically for weeks. [2]
No public figures in the supplied research establish the real compute bill or energy consumption for training trillion-parameter MoEs with Olmo-core 3. Claims that sparse architectures automatically make frontier training cheap are therefore ahead of the evidence.
Choosing an observability layer
The tooling landscape is not short of choices. LangFuse is an open-source, self-hostable option suited to organizations that need control over trace data and deployment. Arize Phoenix is an OpenTelemetry-native option suited to teams already standardising telemetry around that ecosystem. [5]
Neither supplied source provides a stable, comparable current price for LangFuse or Arize Phoenix, so a dollar comparison would be fabricated. Self-hosting also shifts cost into storage, operations, access controls, and retention, which can exceed a nominal software subscription.
LangSmith is suited to teams building primarily in the LangChain ecosystem, where framework integration and experiment management may outweigh portability. Braintrust is suited to evaluation-first workflows where datasets, scorer definitions, and regression analysis are the central operational objects. [5]
Again, no comparable current price figures are supplied for LangSmith or Braintrust. The practical decision is less about a list price than whether traces, evaluators, datasets, and production events can share stable IDs and preserve enough context for an incident to become a regression test.
The goal is not maximal telemetry. It is an accountable loop: observe a bad run, reproduce its relevant state, verify what should have happened, add a durable evaluation, and generate training data only when the verification machinery can distinguish improvement from a more polished failure.
Frequently Asked Questions
What is AI model observability and why is it important?
AI model observability involves capturing structured telemetry and detailed traces of an agent’s execution, including user requests, model calls, tool inputs, environment state, and outputs. It is important because agents can fail silently by producing plausible but incorrect results, so observability helps diagnose errors, understand causal paths, and ensure the system changes the world correctly rather than just completing processes.
How does the trace-verifier loop improve AI agent reliability?
The trace-verifier loop pairs a detailed execution trace with a verifier that tests whether the final state or output meets task requirements. This approach goes beyond monitoring uptime or latency by confirming correctness, catching subtle failures where the agent’s actions look valid but produce wrong results, thus enabling more reliable and auditable AI behavior.
What data should be recorded for effective AI model observability?
Effective observability requires structured logging of key fields such as trace ID, tool name, sanitized arguments, timing, status, response size, retry counts, and environment state changes for tool calls. For model calls, data should include provider, model ID, sampling settings, token counts, finish reason, latency, and prompt or agent version references. Sensitive information should be redacted to protect privacy and comply with regulations.
How can OpenTelemetry be used for AI agent tracing?
OpenTelemetry provides generative AI semantic conventions that structure agent traces into nested spans like invoke_agent for runs, chat for model inferences, and execute_tool for external calls. This parent-child nesting preserves causal relationships, making debugging easier by showing decision paths and retries explicitly. The OpenTelemetry Collector can also filter, redact, and route telemetry to enforce data retention and privacy policies.
What role do verifiers play in AI model training infrastructure?
Verifiers execute logic that inspects an agent’s final output or state to decide if the task was completed correctly, such as checking updates to the right account or ensuring no prohibited changes occurred. They enable automated validation of traces, preventing incorrect agent behavior from being mistakenly used as training data, and support synthetic data generation workflows by providing executable correctness checks.
How we researched this
This article was assembled from 4 published articles, 10 cited references.
Nothing here is based on hands-on testing. Where a figure or finding appears, it belongs to the source cited beside it, and the writing says so rather than implying otherwise. Every source is listed below so you can check it.
Sources
AutoSynthData: Generating Training Data for Enterprise Agents — Hugging Face Blog
AI Agent Observability: Logging, Tracing, and Debugging Explained — Machine Learning Mastery
Introducing Olmo-core 3: Open, scalable training infrastructure for large MoEs — Hugging Face Blog
Adding Temporal Reasoning to Graph-RAG: Tracking Fact Freshness and Staleness — Machine Learning Mastery
AgentTrace: A Structured Logging Framework for Agent System Observability
Introducing Olmo-core 3: Open, scalable training infrastructure for large MoEs
Observability was built for humans. AI agents need something different
AutoSynthData Synthesizes Training Data for Enterprise AI Agents - Extrapolator AI
What is model collapse and why is it a risk for enterprise AI?
Related Articles
AI Safety Incidents and Observability Challenges Explained
Explore how AI safety incidents stem from observability gaps and how action trails and controls improve regulatory compliance and governance.

AI Model Infrastructure Optimization Techniques Explained
Learn AI model infrastructure optimization techniques to improve inference latency, local deployment, tokenization, and GPU utilization effectively.
AI Agents Data Governance and API Integration Best Practices
Explore AI agents data governance and API integration to ensure reliable, real-time responses in specialized domains.

AI Agents Multi-Agent Systems Platforms
Explore AI agents and multi-agent systems platforms with comparisons, costs, observability, and security insights for effective deployment.